Chapter 17: AutoGluon Fundamentals: Tabular Prediction
What you will learn
By the end of this chapter and its companion notebook, you will be able to:
Distinguish between supervised, unsupervised, semi-supervised, and reinforcement learning, and identify which paradigm fits your research question
Quickly test whether there is a predictive signal in your tabular data
Understand how
TabularPredictorhandles preprocessing and model selection automaticallyRead the leaderboard and evaluate model performance on a held-out test set
Use feature importance to interpret what the model is actually responding to
Before committing significant time to building a custom machine learning pipeline, it helps to first ask a simpler question: is there a predictive signal in this data at all? AutoGluon is one of the most practical tools for answering that question quickly. It is an open-source AutoML framework developed by Amazon that trains and compares multiple models automatically, with almost no configuration required [Erickson et al., 2020].
In the context of research, AutoGluon is best understood as a rapid feasibility tool rather than a final modeling solution. The goal is to get a reliable performance baseline in minutes, so you can decide whether the problem is worth pursuing further, and if so, where to focus your attention [AutoGluon Developers, 2024].
Understanding Learning Paradigms
Before jumping into AutoGluon, it is worth pausing on a question that comes up constantly in practice: what kind of learning problem are you actually working with? The answer shapes everything downstream, from how you structure your data to which tools make sense to reach for.
Most machine learning tasks fall into one of four paradigms. They are not equally common in research settings, and knowing which one fits your situation will save you a lot of confusion.
Supervised learning is the most common starting point for researchers. You have a dataset where each observation comes with a known outcome, a label, and the goal is to learn a mapping from inputs to that outcome so you can predict it for new observations. Predicting student dropout risk from course engagement data, classifying grant applications by funding area, estimating crop yield from satellite imagery: these are all supervised problems. The defining feature is that you have ground truth labels to learn from. AutoGluon’s TabularPredictor, which this chapter covers, is a supervised learning tool.
Unsupervised learning drops the labels entirely. You have observations but no outcomes to predict, and the goal is to find structure in the data itself. Clustering patients into subgroups based on symptom profiles, identifying latent topics in a corpus of policy documents, detecting unusual patterns in sensor data without knowing in advance what “unusual” looks like: these are unsupervised tasks. The dimensionality reduction methods covered in Chapter 16, such as PCA and UMAP, are also unsupervised in this sense, as are topic modeling methods covered in Chapter 23.
Semi-supervised learning sits in between. You have labels for some observations but not all, which is a common situation in research: labeling data is expensive and time-consuming, so you might have a small set of manually annotated examples alongside a much larger pool of unlabeled ones. Semi-supervised methods try to use both. In practice, the most accessible version of this idea for researchers is starting with a pretrained model and fine-tuning it on your small labeled set, which is exactly the approach covered in Chapter 26. The pretrained model has already learned useful representations from large unlabeled corpora; your labeled data provides the task-specific signal.
Reinforcement learning is the paradigm where an agent learns by taking actions in an environment and receiving feedback in the form of rewards or penalties. It is the basis for systems like AlphaGo and for training the RLHF (Reinforcement Learning from Human Feedback) step used to align large language models. It is worth knowing about conceptually, but it is rarely the right tool for empirical research questions. Most research datasets are static collections of observations rather than interactive environments, and reinforcement learning requires a fundamentally different kind of problem setup. If you are doing research on reinforcement learning itself as a topic, that is a different matter, but for the vast majority of applied research tasks you are unlikely to need it.
A practical way to think about this: if you have labeled outcomes you want to predict, you are doing supervised learning. If you want to find structure without predefined labels, you are doing unsupervised learning. If you have some labels but not many, semi-supervised methods or fine-tuning a pretrained model are worth considering. And if none of those fit, it is worth stepping back to ask whether the problem is actually a prediction problem at all.
The rest of this chapter focuses on supervised learning for tabular data, which is where AutoGluon is most useful.
What AutoGluon Actually Does
Regardless of which problem type you are working with, AutoGluon follows the same underlying approach. It starts with automated preprocessing — handling missing values, encoding categorical variables, and generating additional features where appropriate, so you do not need to do this manually before handing data over. It then searches across a range of model families (gradient boosting, random forests, neural networks, and others), tunes hyperparameters within each, and combines the best-performing results into a stacked ensemble. Everything runs within a time budget you control.
Each problem type has its own predictor class — TabularPredictor for row-and-column data, TimeSeriesPredictor for temporally indexed data, and MultiModalPredictor for mixed text, image, and tabular inputs — but the design pattern is the same across all three: specify your target, set a time limit, and inspect what came out.
The output is always a ranked leaderboard showing how each model and ensemble performed, rather than a single opaque number. This transparency is what makes AutoGluon particularly useful in a research context.
Supported Problem Types
AutoGluon handles three problem types that come up regularly in research.
Tabular prediction is the most common starting point. If your data is organized in rows and columns — clinical measurements, survey responses, administrative records, experimental outcomes — AutoGluon can tackle both classification (predicting categories) and regression (predicting continuous values) with the same interface. This chapter’s tutorial covers tabular prediction in depth.
Time series forecasting is supported natively, including datasets with multiple series and external covariates. If your research involves longitudinal tracking, repeated measurements, or any data with a meaningful temporal structure, TimeSeriesPredictor is the right entry point.
Multimodal learning allows you to combine text, images, and structured columns in a single model — useful for datasets that mix clinical notes with lab values, or survey instruments that include both rating scales and open-ended responses.
Tutorial: Predicting House Prices
To make this concrete, let’s walk through what tabular prediction actually looks like from start to finish. The tutorial uses a 500-row sample based on the California Housing dataset, originally from Pace and Barry (1997) [Pace and Barry, 1997]. Each row represents a census block group, and the task is to predict median house value from neighborhood characteristics — a regression problem. The workflow is identical for classification; only the label column and evaluation metric differ.
All code, explanatory notes, and hands-on exercises live in the Colab notebook. Clicking the badge opens a temporary session — click “Copy to Drive” inside Colab to save your own copy.
![]()
The Core Call
The full training workflow comes down to a few lines. You tell AutoGluon which column is the target, what metric to optimize, and how much time it can use:
from autogluon.tabular import TabularPredictor

predictor = TabularPredictor(
    label="MedHouseVal",
    eval_metric="rmse",
    path="autogluon_housing_model"
).fit(
    train_data=train_df,
    time_limit=120,
    presets="medium_quality"
)
AutoGluon infers the problem type from the label column and handles all preprocessing internally. The time_limit is the single most important lever — two minutes is enough for a first feasibility pass, and you can increase it later if the results look promising.
What the Leaderboard Shows
Once training finishes, the leaderboard ranks every model and ensemble that was trained, showing test and validation scores side by side. Here is an example of what you would typically see for a tabular regression task:
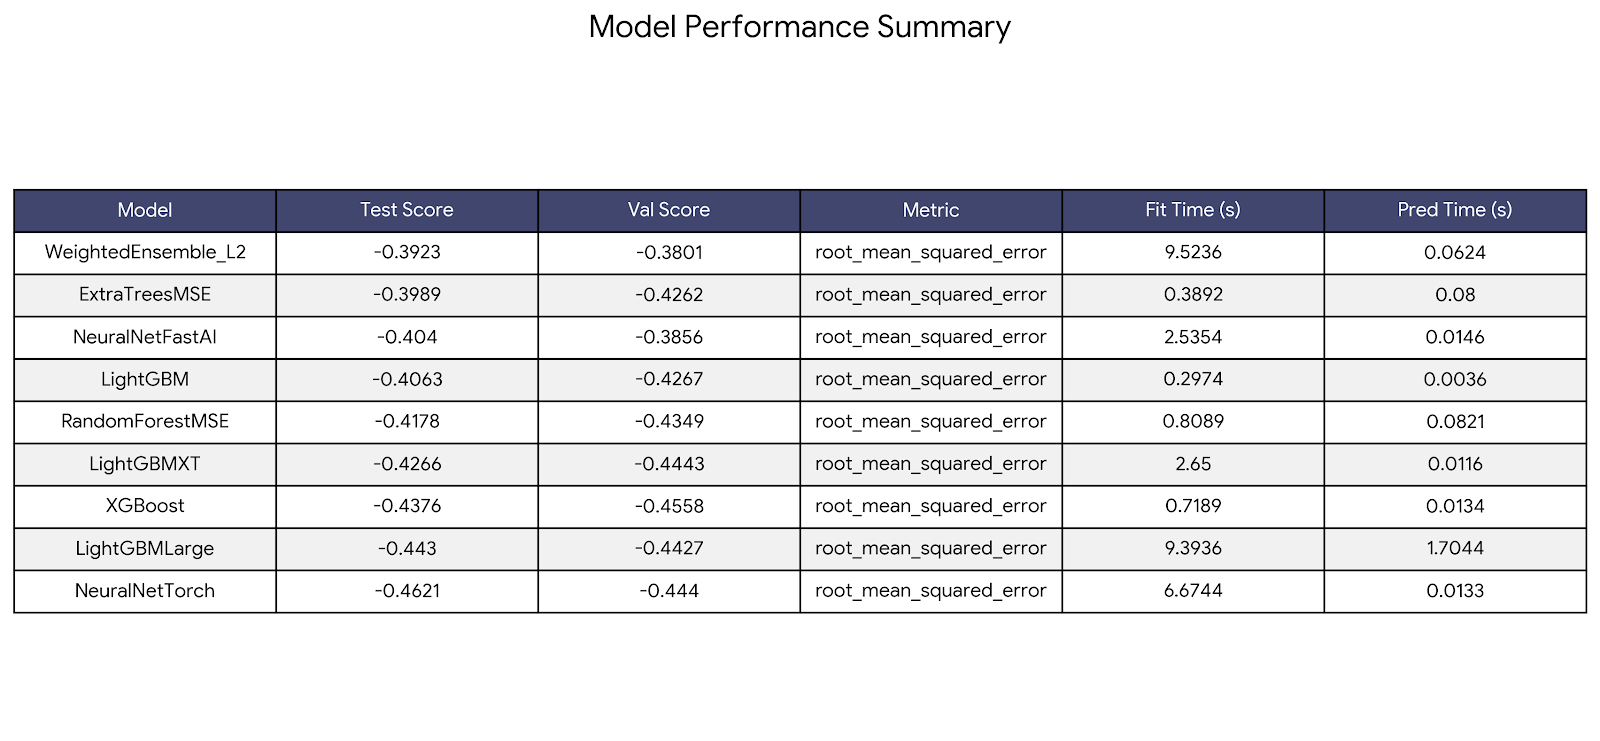
AutoGluon reports RMSE as a negative number so that higher values always mean better performance — a convention it applies consistently across all metrics. The ensemble (WeightedEnsemble_L2) typically sits at the top. If a single model is close behind, that simpler model may be worth preferring when interpretability matters more than squeezing out the last bit of performance.
The notebook walks through each step in detail — data splits, metric selection, training, the leaderboard, evaluation, and feature importance — with explanatory notes and hands-on exercises at the end.
What’s Next
The next two chapters extend this same feasibility-testing workflow to other data types. Chapter 18 covers time series forecasting with TimeSeriesPredictor, and Chapter 19 covers multimodal learning with MultiModalPredictor for datasets that combine text, images, and tabular columns. The structure and design pattern are the same across all three, so once you are comfortable with this chapter, the others will feel familiar.
Frequently Asked Questions
Does AutoGluon support R?
Not natively — AutoGluon is a Python-only framework. If your workflow is primarily in R, the most practical path is to run AutoGluon in Python for the modeling step, then export the predictions or feature importance as a CSV and continue your analysis in R. Technically, R users can call Python via the reticulate package, but this adds complexity and is not the recommended workflow.
Can I rank models by two metrics at the same time?
The leaderboard only ranks by the single eval_metric you set at training time. However, once you have the leaderboard as a DataFrame you can build a combined ranking yourself — normalize each metric to a 0-1 range and take a weighted average. The notebook’s “Common Questions” section shows a working example of this.
The ensemble always wins — how do I evaluate individual models?
By default, predictor.evaluate() reports the performance of the best model (the ensemble). To evaluate any individual model, pass its name from the leaderboard using the model argument:
predictor.evaluate(test_df, model="LightGBM_BAG_L1", auxiliary_metrics=True)
You can loop through all model names to build a full comparison table across multiple metrics, which lets you decide whether the ensemble’s edge over a simpler model is worth the interpretability trade-off. The notebook walks through both approaches.
Research Considerations
AutoML lowers the barrier to getting a model running, but it does not lower the bar for responsible research practice.
Data leakage is the most common pitfall. Features derived from future information, variables that are proxies for the outcome, or aggregations that inadvertently incorporate test data can all produce inflated performance estimates that do not hold up in practice. If your results look surprisingly good, leakage is the first thing to investigate.
The test set is a one-time measurement. Once you evaluate on it, any subsequent changes to your model or features should ideally trigger a fresh split. Repeatedly adjusting based on the same test results is a form of overfitting, even when the decisions feel subjective.
AutoGluon is a starting point, not an endpoint. The feasibility test answers “is there signal here worth pursuing,” not “what is my final model.” If the results look promising, a custom pipeline with careful feature engineering and domain-informed design will typically outperform AutoGluon’s defaults on your specific problem.
For any data covered by HIPAA or other governance policies, do not upload sensitive data to a public Colab notebook. Use an approved institutional computing environment or a local installation instead. Chapter 13 covers how to choose a resource.
If You’re at U-M
Approved options at U-M include Armis2 for HIPAA-covered data and Great Lakes for other sensitive workloads. See AI Resources at the University of Michigan.
Last reviewed: April 2026. Tool-specific content in this chapter refers to AutoGluon 1.x. If you notice outdated content, open an issue on GitHub.
References
Nick Erickson, Jonas Mueller, Alexander Shirkov, Hang Zhang, Pedro Larroy, Mu Li, and Alexander Smola. Autogluon-tabular: robust and accurate automl for structured data. arXiv preprint arXiv:2003.06505, 2020.
AutoGluon Developers. AutoGluon: automl for text, image, and tabular data. https://auto.gluon.ai/stable/index.html, 2024.
R. Kelley Pace and Ronald Barry. California housing dataset. StatLib Repository. Reproduced in Géron, A. (2019). Hands-on machine learning with Scikit-Learn, Keras, and TensorFlow. O'Reilly Media., 1997.